DataVis

US Storms Since 1996
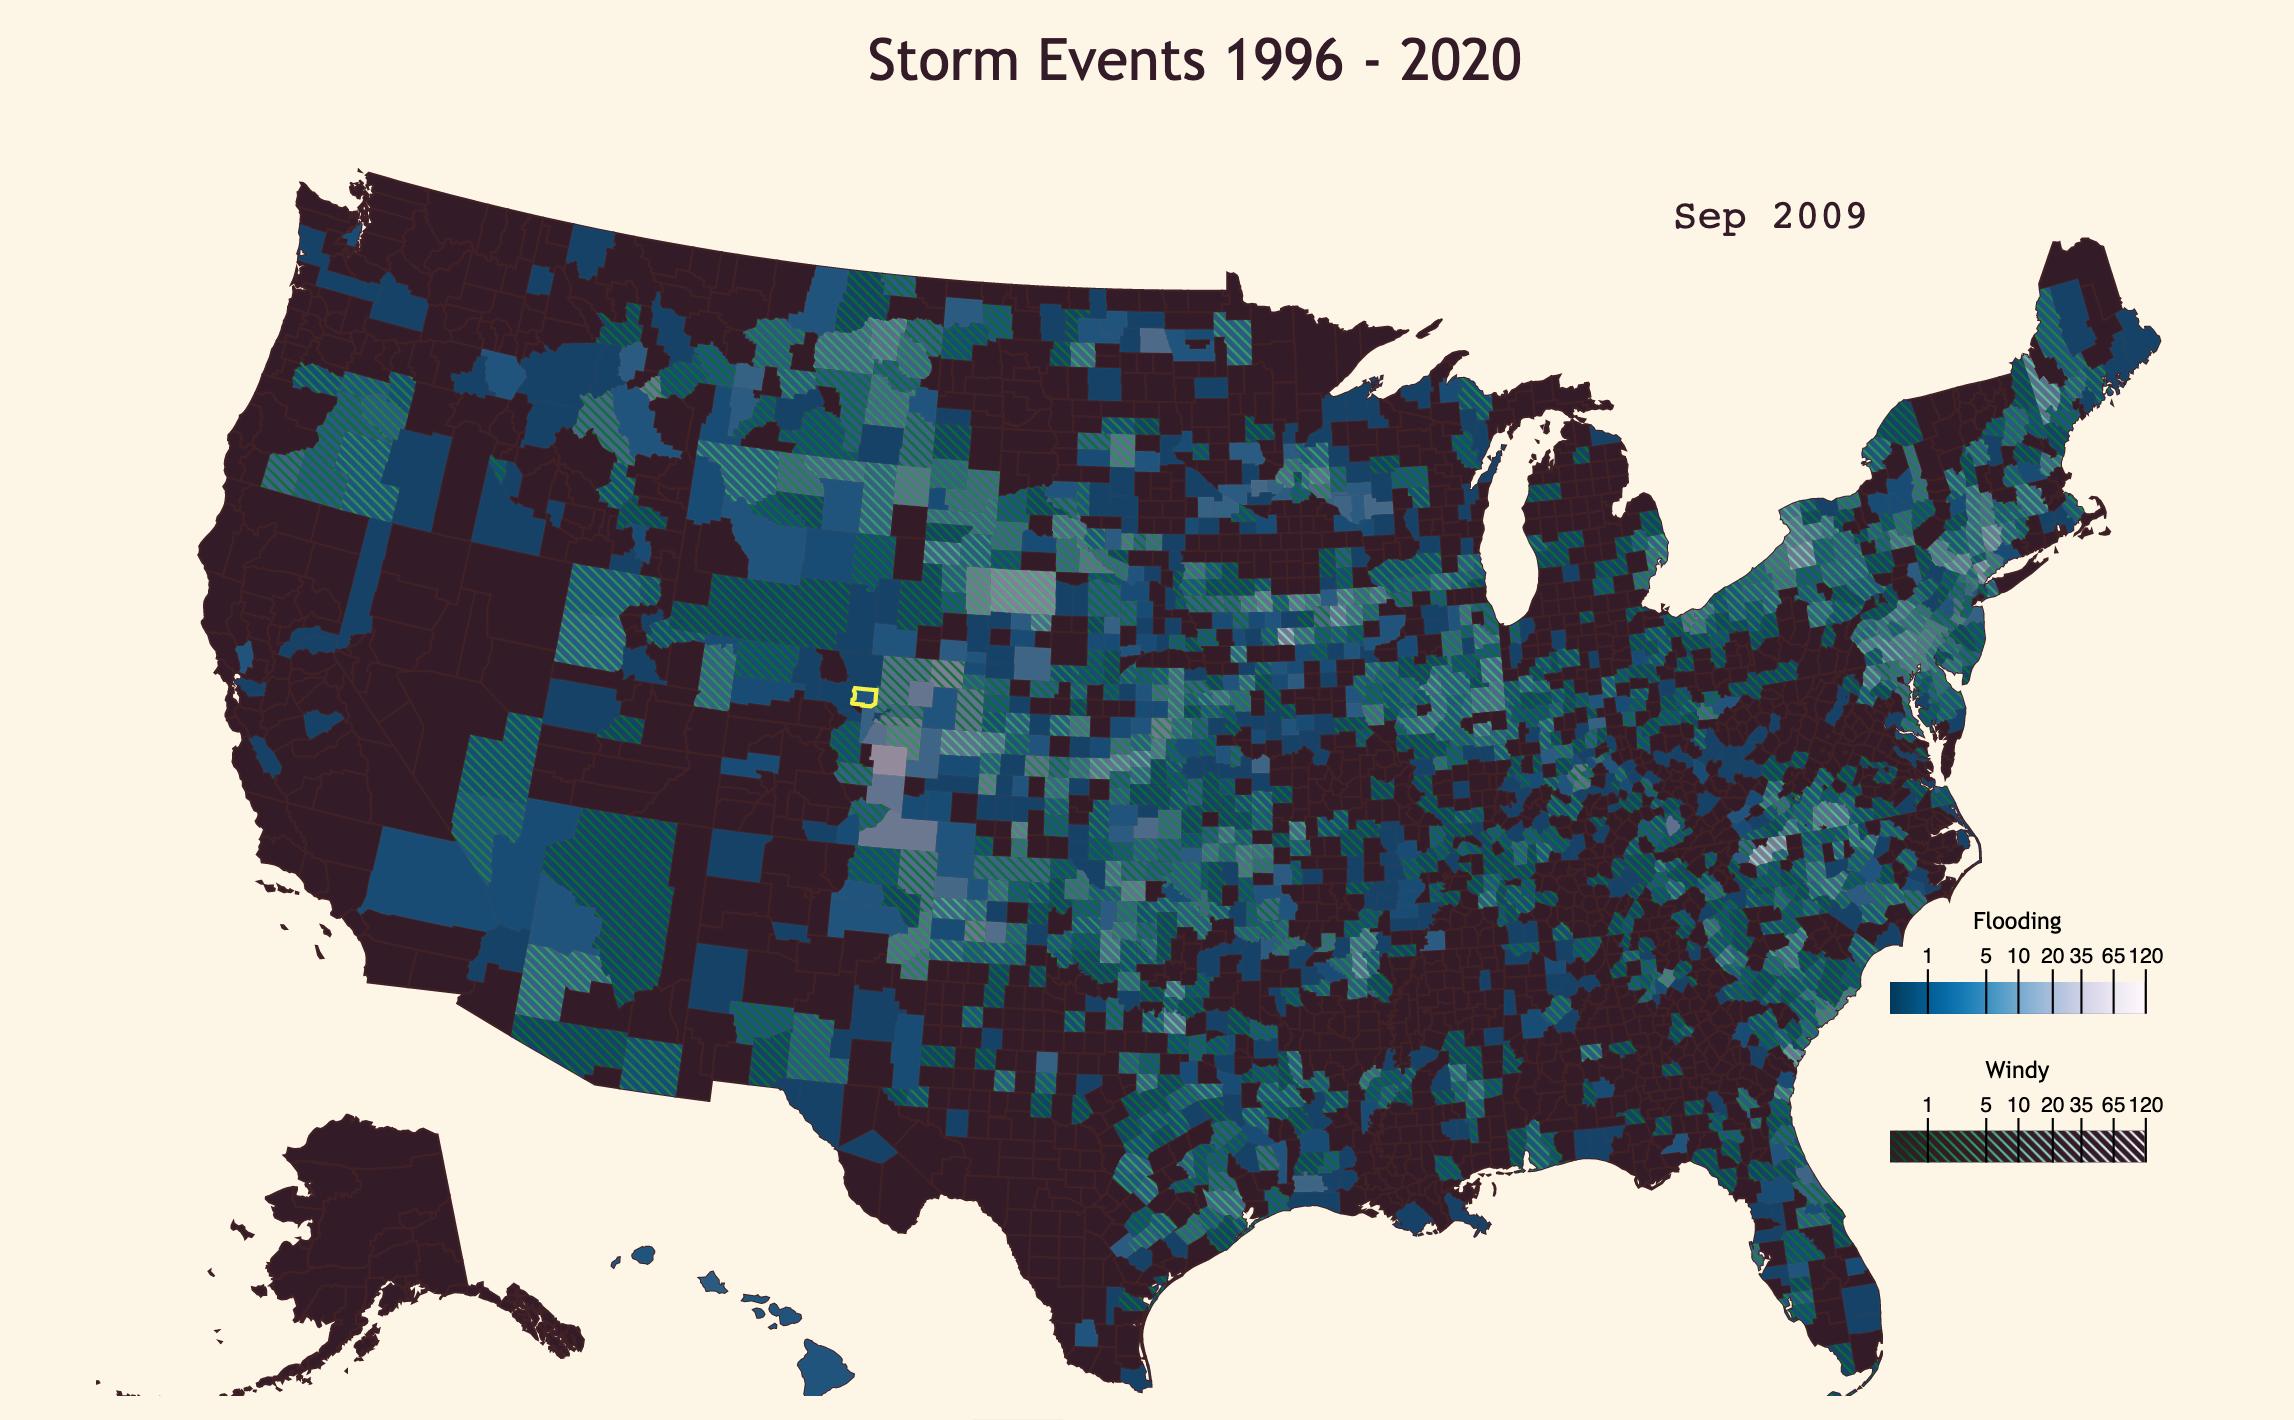
Drawing from the Storm Events database from the National Weather service, I set out to visualize a simple aspect of the data: how many storms in certain categories (involving flooding or high winds) happened in each county every month? For this, I utilized D3 and TopoJSON, as well as Webpack and Babel for development.
Read More

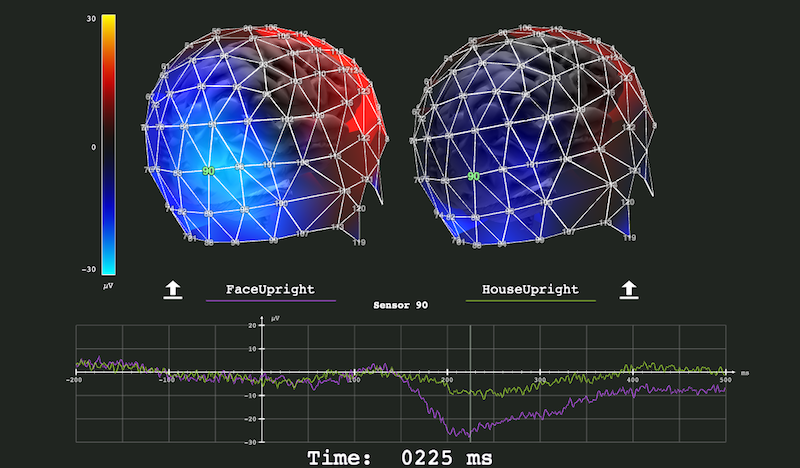
ERP Viewer

Diving into the world of Neuroscience and Autism at the Yale Child Studies Center, I created this web app to display Event Related Potentials, or ERPs. ERPs are a method of analyzing Electroencephalogram (EEG) data by averaging many examples of someone’s brain reacting to the same stimulus. EEG, in case you’re unfamiliar, is electric potentials recorded from the scalp, and one of the cheapest and easiest ways of seeing what a brain is up to.

Read More

Matrix Viewer

The Web Matrix viewer was made to display pre-calculated graphs of sparse matrices. Sparse matrices are simply big data tables that mostly consist of zeros. Based on work by Tim Davis and Yifan Hu at the University of Florida, I built a program to calculate a somewhat stable shape for a graph representation of sparse matrices. What you see here is the output, visualized in three dimensions.

Read More